What SKU rationalization is
SKU rationalization is the deliberate review of your assortment to remove items that consume more than they return.
The cost of a SKU isn't just the inventory sitting in it. Every SKU carries a share of warehouse space, a listing to maintain across every channel, a photography and copy investment, a line in every count, a reorder decision to make repeatedly, and a slice of the attention of whoever manages pricing. A SKU generating $400 a year in gross margin is very likely costing you more than that in overhead nobody's tracking.
The upside is real. Cutting the genuine tail raises inventory turnover, frees working capital for depth on the things that sell, and reduces operational drag in a way that shows up everywhere. The risk is equally real, and it's entirely in which items you classify as tail. Getting that classification right is what the assortment tools I build for stores do continuously.
The 80/20 trap
Revenue concentration in retail is genuinely steep: a minority of SKUs really does drive most of the top line. That's not the problem. The problem is what people do with it.
- Revenue rank isn't margin rank. a high-volume item at 18% margin can contribute fewer absolute gross margin dollars than a slow item at 62%. Rank by contribution dollars, not revenue, and the list reorders significantly. GMROI is that ranking with the inventory investment in the denominator.
- Some tail exists to sell the head. this is the one that costs people money. In a size-run category the outer sizes rarely justify themselves on their own numbers. They exist so the run is complete, so the listing doesn't read as picked-over, and so the customer who wears a 13 doesn't learn you aren't a place that carries their size. Cut them on individual performance and you'll watch the core sizes soften without an obvious cause.
- Recency masquerades as performance. twelve months of revenue treats an item launched in month eleven the same as one live all year. Normalise to velocity per week in stock, or new items get cut for the crime of being new.
- Channel mix hides inside the average. a SKU can be dead on your storefront and healthy on one marketplace. Blended numbers show a weak item; the truth is a listing or pricing problem on four channels and a perfectly good product.
Rationalize at the variant level
This is the whole thing, and it's where most efforts fail before they start.
Take a style with a full size run. Aggregate numbers look mediocre: moderate revenue, unremarkable turnover, above-average age. On a style-level review it's a cut candidate. Underneath: the four core sizes sold through in three weeks and have been out of stock most of the year, and the outer sizes have barely moved. The style average is the arithmetic mean of a stockout problem and an overstock problem, and it looks like mediocrity.
Cut the style and you eliminated one of your best sellers. Buy it again at the same depth curve and you repeat the same mistake. The correct action isn't cutting or keeping. It's changing the buy: more depth in the core sizes, less in the tails, same style. You can only see that at the variant level, and no style-level report will ever show it to you.
The same principle applies to colourways. One colourway carrying a style is extremely common, and the style-level number will never tell you which one.
Four tests before you cut
A SKU should fail multiple tests before it is cut. Failing exactly one test almost always points to a fixable problem rather than a bad product.
Fails one test: investigate. Fails two: watch it. Fails three or four: cut it.
- Contribution. does it generate meaningful gross margin dollars per year, net of channel fees? Absolute dollars after everyone takes their cut. Fees in this category realistically run 8–15% depending on the platform, and that spread changes which items are marginal.
- Velocity. units per week in stock. An item that's been out of stock for four months isn't slow, it's absent.
- Structural role. does it complete a size run, anchor a category, or exist so a bundle works? Structural SKUs get judged on the performance of what they support.
- Channel. is there any channel where it performs? If yes, the problem is your listings elsewhere. Fix that first. It's cheaper than replacing the product and it usually takes an afternoon.
What to do with what you cut
A cut decision and a liquidation decision are separate, and conflating them costs money.
- Cut means stop reordering. that's it. It doesn't mean fire-sale the remaining units. If the on-hand is still selling at a reasonable clip, let it run out at full price and simply don't replace it. You collect the margin and the SKU retires quietly.
- Liquidate only what's genuinely dead. aged and flat on velocity. Run it down the markdown ladder rather than dumping it: full price through 45 days, −10% at 46, −20% at 61, clear past 90.
- Archive rather than delete. keep the historical data. A style you cut in a soft year is a style you might want to evaluate again, and having its real numbers beats reconstructing them from memory.
Doing this continuously instead of annually
An annual rationalization is a big project that produces a list of things you should have caught eight months earlier.
The continuous version is a standing view: variant-level contribution, velocity, age and channel performance, updated as inventory syncs. Items drift into a watch state before they become cut candidates, which means most of them get fixed with a price change or a listing improvement instead of a cut.
The annual review still has a place. It's where you make structural calls about categories and vendors. But it shouldn't be the first time you learn that a SKU has been dead since March. The free consultation runs the four tests on your catalogue as a first pass.
Frequently asked questions
- What is SKU rationalization?
- Deliberately cutting products that consume more working capital, space and attention than they return, in order to concentrate resources on what actually performs.
- How do you decide which SKUs to cut?
- Score at the variant level on contribution dollars after fees, velocity per week in stock, structural role in a size run or category, and per-channel performance. Cut only what fails three or four of those. A SKU failing one test is a pricing or listing problem.
- Does the 80/20 rule apply to SKU rationalization?
- Directionally, but it misleads when applied naively. Revenue concentration says nothing about margin concentration or about whether the tail exists to make the head sellable. Cutting the bottom 20% by revenue frequently removes profitable low-volume items and size-run completers.
- Will SKU rationalization reduce my revenue?
- Done at the variant level with structural roles accounted for, no. It typically raises margin and turnover while holding revenue flat. Done by sorting on revenue and cutting the bottom, frequently yes.
- How is SKU rationalization different from inventory reduction?
- Inventory reduction lowers the depth you carry. Rationalization lowers the number of distinct things you carry. You can do either without the other, and the second one is what reduces operational drag.
Score your assortment without the spreadsheet
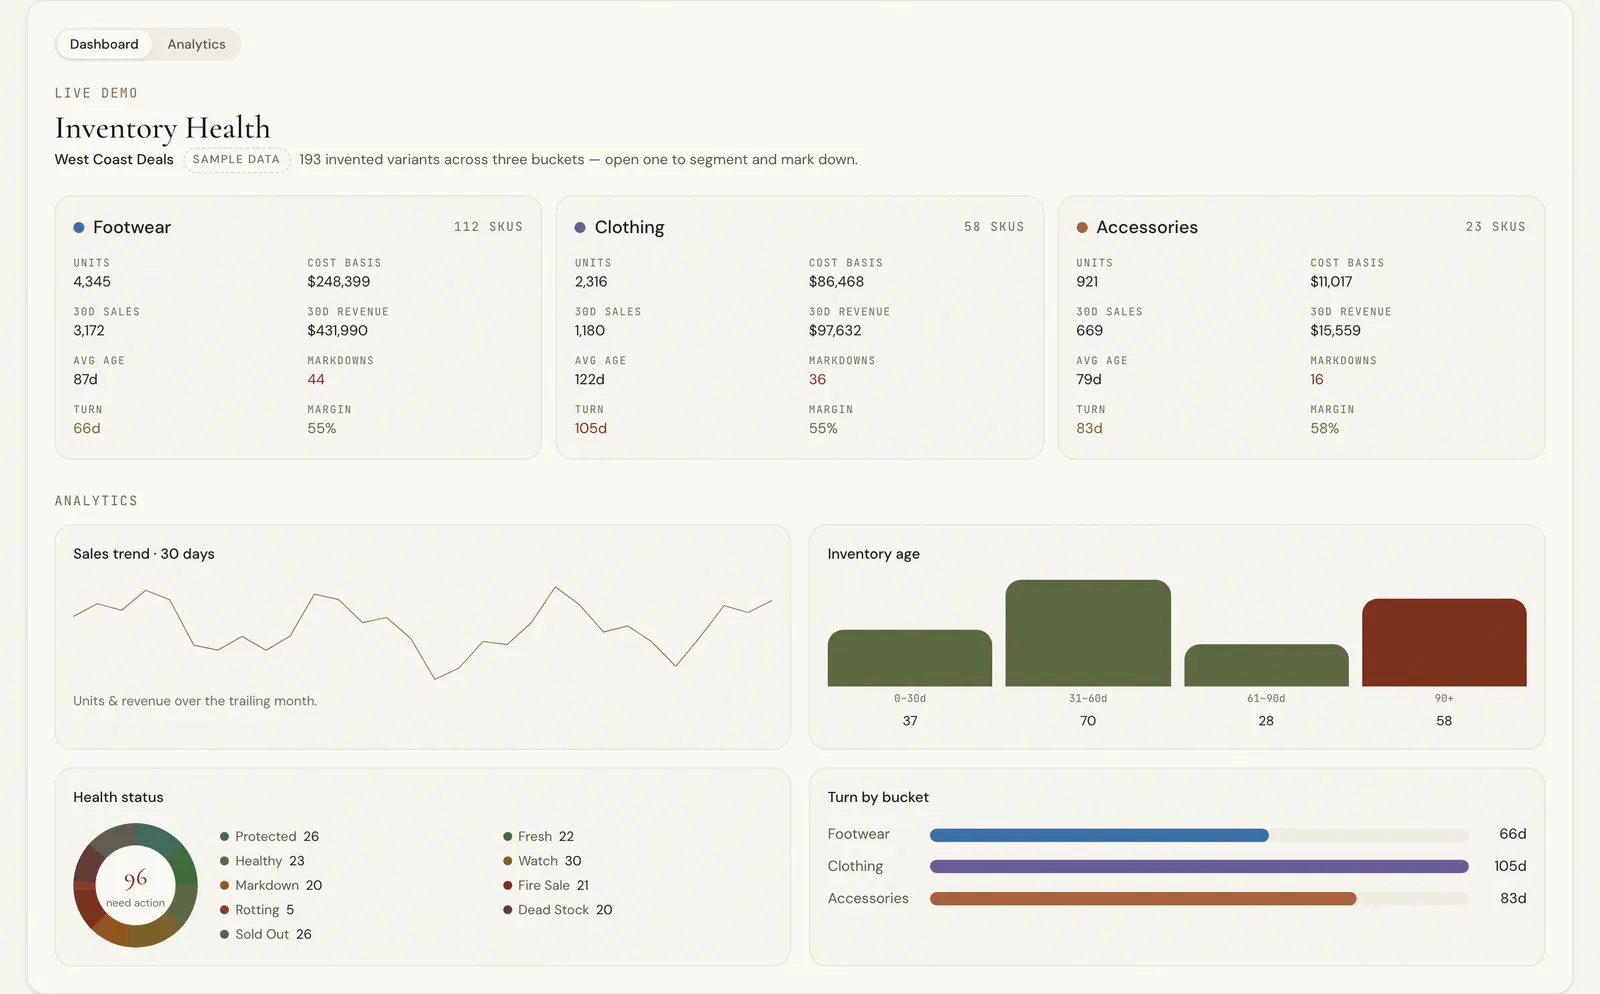
The Inventory Health Dashboard grades every variant continuously on age, velocity and days of supply, so cut candidates surface as they develop rather than at year-end. It runs at the variant level by design: the size-curve problem above is exactly what it was built to expose.