The number you're watching is the wrong one
Most operators watch sell-through, and sell-through is an average. A store can post a perfectly healthy blended figure while a third of its variants haven't moved a single unit in six weeks. The average is being carried by the winners, which is exactly what an average does. The company-wide turnover ratio hides the same thing the same way.
The number that actually predicts dead stock is per-variant and boring: how many days has this specific unit been sitting, and when did this specific variant last sell. Not the style, the variant. A style can look fine on aggregate while three of its nine sizes have been untouched since February, and those three are where the money is trapped.
Why it's always found too late
Slow movers don't cluster. They're scattered across sizes, colourways and collections, each one individually too small to notice: a pair here, two there. Nothing about a single dead variant is alarming. It's only alarming in aggregate, and aggregate is precisely the view that hides it.
So it gets found at inventory count, or when cash gets tight enough that someone goes looking. By then the arithmetic has moved against you. A variant you could have cleared at 20% off in month two often needs 50% off by month six, because the market moved on and the item is now competing with newer stock at a discount. Waiting is not neutral. Waiting is the thing that makes the discount bigger. Catching it earlier is the whole point of the inventory tools I build for stores.
The method, in a spreadsheet
You don't need software to start. You need three columns you probably already have, days since received, units sold in the last 30 days, and units on hand, and a rule that turns them into a status. An inventory aging report needs two more, cost basis and velocity, and this is the first version of it.
The ladder I use is age-first, because age is the only input that always moves in one direction. Every variant gets a status, and every status maps to an action rather than a feeling:
- 0–29 days. Fresh. Leave it alone. It hasn't had time to tell you anything yet, and discounting here is just giving away margin on stock that was always going to sell.
- 30–45 days. Healthy. Still fine, but this is where you start looking rather than assuming.
- 46–60 days. Watch. A shallow nudge, 10% or a coupon aimed at just these variants, is cheaper here than a deep cut in a month's time.
- 61–90 days. Markdown. Around 20%. This is the last rung where a normal discount reliably works.
- 91+ days. Fire sale. 30% and upward. You're now recovering cash, and the goal is to stop it getting worse.
- No sales in 90 days. Dead, regardless of age band. Mark down hard, bundle it, or liquidate. The number to optimise is recovered cash.
Two overlays that stop the ladder doing damage
A pure age ladder will eventually do something stupid, so it needs two exceptions.
The first is protection. Anything selling fast enough is exempt from markdown no matter its age: a variant that's 100 days old but turning over steadily is not a problem, it's a product with a long tail, and cutting its price costs you money for nothing. The second is a floor. Every suggested cut gets checked against cost, and anything that would land below it is flagged rather than hidden. You may still choose to sell below cost to free the cash. You should never do it by accident.
One more that only matters once you're running this regularly: after you mark something down, give it a soak period, a week or two where the system leaves it alone. Otherwise the next pass sees an aging variant that still hasn't sold and recommends cutting it again, and you'll walk a price into the ground in a fortnight.
Discounting is not the only lever
The default response to aging stock is a sitewide sale: 30% off everything, clearance event, done. It works, in the sense that inventory leaves. It's also the most expensive way to do it, because a blanket discount can't tell the difference between the colourway nobody wanted and the one that was selling perfectly well at full price. You give away margin on your winners in order to clear your losers, and you teach regular customers that waiting is always rewarded.
That happens because all-or-nothing is the only option available when you can't tell variants apart. Once you can, a middle ground opens up: a coupon targeted at specific variants, which clears them without publishing a lower price to everyone; a straight markdown on just the batch that needs one; bundling slow sizes with fast ones; and liquidation reserved for what's genuinely dead. Marking to cost should be the last move available to you, not the first one you reach for.
When it's worth automating
The spreadsheet version works, and for a few hundred variants it may be all you ever need. It stops working for a reason that has nothing to do with the maths: it's a job someone has to remember to do, and it takes hours, so it gets done during a quarterly panic instead of every week.
That's the real argument for scoring the catalogue automatically. The calculation is easy, and a calculation nobody runs is worth nothing. When I put this in as a dashboard rather than a spreadsheet, the long tail got reviewed every day instead of once a quarter. Worth being straight about what that does and doesn't prove: it's one business, and the reorder planner was doing work alongside it. The mechanism is what generalises. Whether that is a custom inventory tool or an off-the-shelf one is a separate decision.
Start here
Pull your variant list with days-on-hand and 30-day units. Sort by age descending. Look at everything past 60 days with zero sales in the last month, and total up the cost value sitting in that list.
That number is usually the surprise. Most people expect it to be a rounding error and find a month of profit. Whatever you do next, spreadsheet, rule, tool, knowing that number is the part that changes decisions. The free consultation pulls it from your own exports.
See the method running
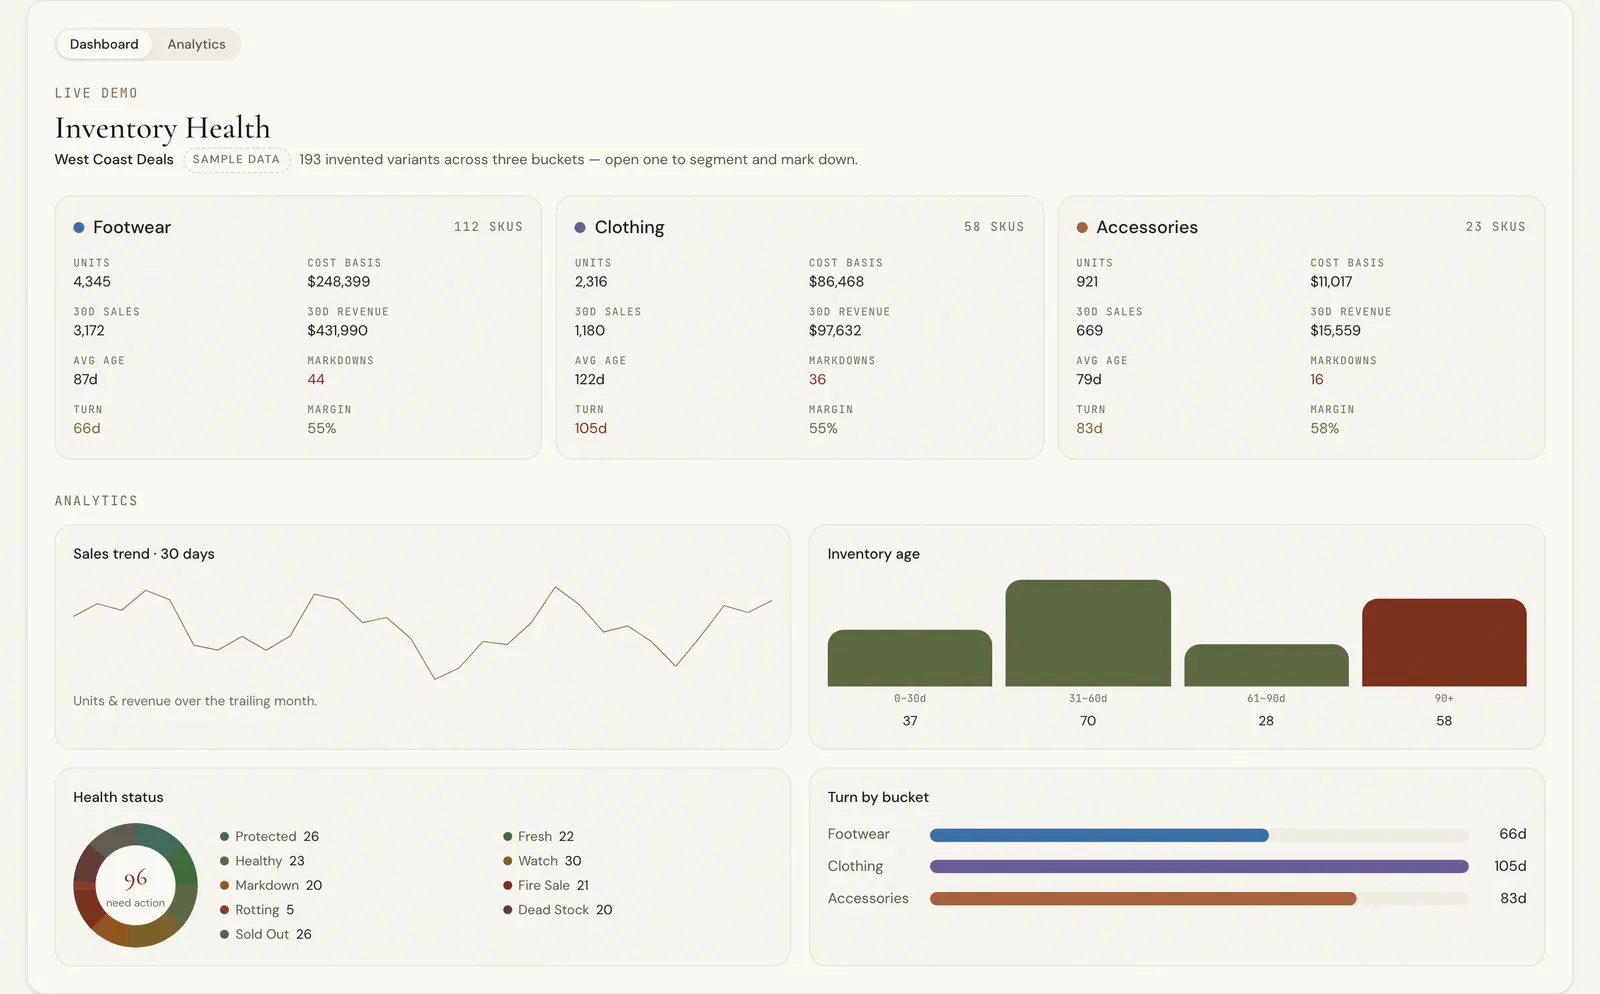
The Inventory Health Dashboard on this site is this ladder as a working tool, on sample data you can click through: buckets, statuses, and the bulk markdown workflow. If your catalogue needs its own version, that's what I build.