What is inventory turnover?
Inventory turnover measures how many times you sold and replaced your entire inventory over a period, usually a year.
If your turnover is 6, you cycled through your full stock six times in twelve months. Every dollar tied up in inventory came back to you and went out again six times. If your turnover is 2, that same dollar only worked twice.
This matters because inventory is cash you already spent. A $200,000 inventory turning six times generates the same sales as a $600,000 inventory turning two times, with $400,000 less capital trapped on the shelf. Freeing that capital is what the inventory tools I build for stores are for.
The inventory turnover formula
There are two versions in circulation, and they give very different answers.
Inventory Turnover = Cost of Goods Sold ÷ Average Inventory (at cost)
Inventory Turnover = Revenue ÷ Average Inventory
Why the formula you pick changes the answer
The revenue version compares a retail-priced numerator against a cost-priced denominator, so it inflates your ratio by roughly your gross margin. At a 50% margin it will roughly double your number.
How much does this matter? Take the public Apparel, Footwear & Accessories companies. Measured on sales, the industry turns inventory 6.34x. Measured on cost of sales, the correct way, the same companies turn 3.16x. Same businesses, same period, a number twice as flattering.
Use COGS. If you benchmark yourself on the revenue version against someone using the COGS version, you'll conclude you're twice as efficient as you are.
Calculating average inventory
Both figures at cost.
Two-point averaging is fine for a stable business. If you're seasonal, and if you sell apparel or footwear, you are, average your monthly ending balances instead. A beginning-and-ending-of-year average taken across a Q4 peak and a January trough will misrepresent the whole year.
Average Inventory = (Beginning Inventory + Ending Inventory) ÷ 2
A worked example
You sold $900,000 in COGS last year. You started January with $180,000 in inventory at cost and ended December with $120,000.
You turned your inventory six times.
Average Inventory = ($180,000 + $120,000) ÷ 2 = $150,000 Inventory Turnover = $900,000 ÷ $150,000 = 6.0
Inventory turnover days
Turnover as a count is abstract. Convert it to days and it becomes something you can act on.
At a turnover of 6.0, that's 61 days: the average unit sits about two months between arriving and shipping.
Days is the better working metric because it's directly comparable to your payment terms. If your inventory sits 61 days and your supplier terms are net 30, you're financing that gap for a month on your own cash. Close the gap and you've funded growth without borrowing. There's more on this in days inventory outstanding, including the forward-looking version you'd actually reorder from.
Days Inventory Outstanding = 365 ÷ Inventory Turnover
What is a good inventory turnover ratio?
There's no universal answer, and anyone who gives you one is selling something. It depends on margin structure, price point, and category.
Published benchmarks for fashion and apparel generally land in the 6–12x range (roughly 30–60 days), electronics around 4.5–8x, and home goods and furniture around 2.5–5x. Treat these as orientation. Most published benchmark tables don't disclose whether they used the COGS formula or the revenue formula, which as we saw can change the number by 2x.
Two adjustments are worth making before you judge your own number:
- High-margin, low-volume inventory should turn slower. if you make 60% on a unit, holding it for 90 days can be more profitable than discounting it to move in 30. Turnover is a means to margin, which is exactly what GMROI measures and turnover can't see.
- Higher is not automatically better. a turnover of 20 in a category where peers run 6 usually means one of three things: you're chronically understocked and losing sales to stockouts, you're discounting too aggressively, or you're carrying so little depth that you can't service demand when it arrives. Lost sales don't appear anywhere in the turnover calculation, which is exactly what makes a very high ratio dangerous. It looks like efficiency right up until you read the revenue line.
Why your company-wide turnover number is lying to you
Here's the part most articles skip. A single blended turnover figure is an average across everything you own. It tells you nothing about where the problem is, because it's mathematically designed to hide it.
Say your blended turnover is a respectable 6.0. Underneath that number, 30% of your SKUs turn 15x and stock out repeatedly, 40% turn around 6x and are basically fine, and 30% haven't moved in 120 days and are quietly financing nothing.
The healthy middle and the fast movers average out the dead weight. You look fine. You are not fine. You have a stockout problem and a dead stock problem simultaneously, and the blended number is actively concealing both. Three cuts make it useful:
- By variant. in footwear and apparel, turnover is a size-curve problem. A style that looks healthy in aggregate is usually a few core sizes selling out while the tails sit for a year. The style-level number hides it; the variant-level number doesn't. This is the core of any real SKU rationalization.
- By channel. the same unit has different velocity and a different fee structure everywhere it's listed. Marketplace commissions in this category realistically run from around 8% to around 15% depending on the platform, before shipping and returns. A SKU turning well on a high-fee channel and slowly on a low-fee one is a very different business problem than the reverse, and the blended number treats them as identical. Amazon grades its channel alone with the IPI score, which reads sell-through on units over a quarter.
- By age cohort. turnover is backward-looking. It tells you what already happened. Days-on-hand by receiving date tells you what's about to happen, which is the thing you can still do something about. That's what an inventory aging report is for.
What to actually do with the number
Turnover is a diagnostic. Once you've cut it properly, two decisions follow.
Set markdown triggers by age. A workable default: hold at full price for 30 days, take 10% off if it hasn't moved, 20% at day 45, and clear anything past 60 days. The exact ladder matters less than the fact that it's automatic. Discounting by gut feeling means you discount when you notice, and you notice late, usually a full season late, when the markdown has to be twice as deep to work. The age ladder that catches dead stock early is that default written out.
Set reorder points from velocity. If a variant turns 15x, it needs a reorder trigger and safety stock. If it turns 1x, it needs to stop being reordered at all. Most operations reorder what they remember selling, which biases hard toward whatever moved most recently rather than whatever moves most consistently.
Neither decision requires new software. Both require the data cut at the variant level, which is where the work usually stalls, because it lives across a warehouse system, a storefront, and a stack of marketplace exports that don't agree with each other. That join is usually the point where custom inventory software earns its keep, and the free consultation starts by pricing what it costs you by hand.
Frequently asked questions
- How do you calculate inventory turnover ratio?
- Divide cost of goods sold by average inventory at cost. Average inventory is beginning inventory plus ending inventory divided by two, or the average of monthly ending balances if your business is seasonal.
- What does inventory turnover ratio tell you?
- How many times you sold through and replaced your entire inventory in a period. It's a measure of how hard your working capital is working.
- Is a higher inventory turnover ratio better?
- Up to a point. Higher turnover means less capital tied up, but a ratio well above your category norm usually signals stockouts or over-discounting. Lost sales never show up in the turnover calculation, so a very high number can look like efficiency while it's costing you revenue.
- What's the difference between inventory turnover and sell-through rate?
- Turnover measures replacement cycles over a period, typically annually. Sell-through measures what percentage of a specific receipt sold in a specific window: units sold divided by units received. Turnover judges the business; sell-through judges a buy.
- What is a good inventory turnover ratio for e-commerce?
- Fashion and apparel benchmarks generally run 6–12x, electronics 4.5–8x, home goods 2.5–5x. Confirm which formula a benchmark used before comparing yourself to it.
Ready to see your real numbers?
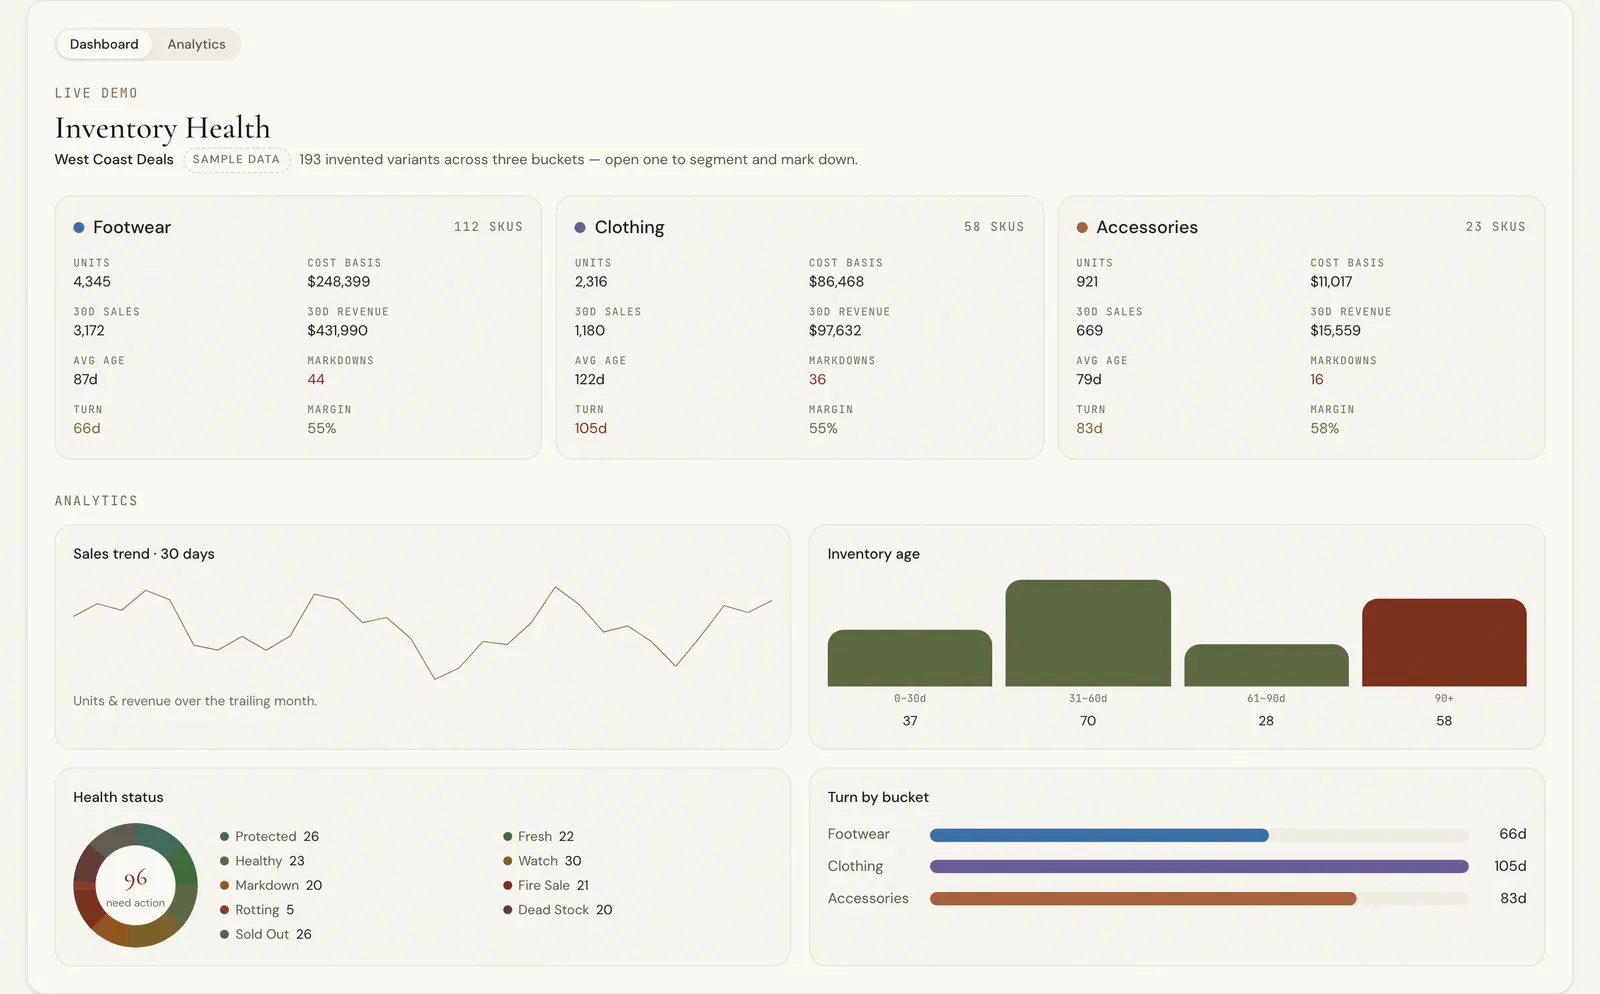
Blended turnover hides the two problems that actually cost you money. The Inventory Health Dashboard cuts days of supply, sell-through, and age by variant, and flags what needs a markdown before the markdown has to be deep. If your data lives across a warehouse system, a storefront, and a pile of marketplace exports, that's the normal starting point.